
After the Alumni Events, Alumni Outreach and DARCOMM teams spent many months planning, pivoting and promoting, we were ecstatic to see the outstanding results from the 40 Under 40 Class of 2020 announcement on July 17, 2020.
Before announcement day arrived, we meticulously planned how we wanted to announce this year’s class. We even created a minute-by-minute timeline for the day of the announcement.
We followed the model from previous years, announcing the list in the Bulldog Bulletin shortly after our honorees and applicants were notified via email. Once the Bulldog Bulletin was sent, we posted links to the list on all of our social platforms. On Instagram Stories we posted a frame recognizing each honoree and tagged the honoree (and the school or college they attended) so that it could be easily shared.
In short, we dramatically increased the number of visits to the website this year vs last year (which had been our best year to date). See the highlights below:
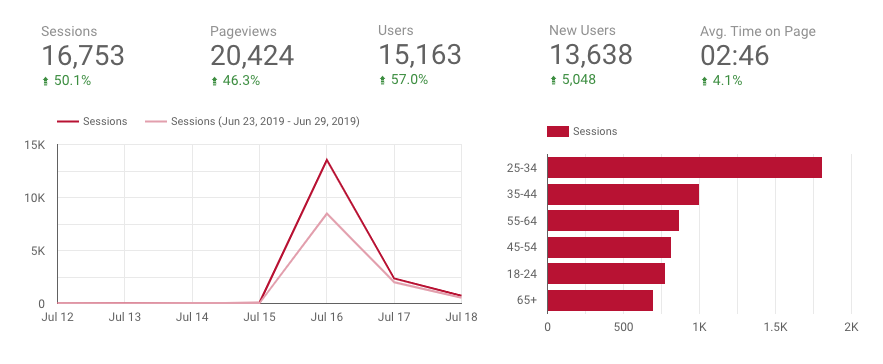
Overall, we saw a 50% increase in traffic to the 40 Under 40 landing page. You can clearly see the increase year over year in the visualization above. You can also see a break down of the demographics of our site visitors in the chart on the right. The 25-34 demographic driving most of the visits.
What drove the additional traffic? We saw a dramatic increase in the number of clicks from the Bulldog Bulletin. While clicks from Facebook were also up, the Bulldog Bulletin saw over twice the number of clicks compared to the previous year.
2020: 9,414
2019: 4,352
This performance increase was especially surprising since the open rate of this year’s Bulldog Bulletin was slightly lower (14% vs 15%) than last year.😲
Numbers and insights from this year’s announcement on social media
- Impressions: 12,436
- Engagements: 665
- Link clicks: 385
- Likes: 50
- Retweets: 9
Last year we had about equal impressions/engagement on our announcement post on Twitter, but the most notable thing for me this year was that on the day of the announcement the #UGA40U40 hashtag was used 25 times by SCUDS, honorees, and honorees’ friends/businesses. That is more posts than we’ve gotten in past years.
- 6,815 reach
- 1,474 Reactions, Comments & Shares
- 45 likes
- 4 comments
- 20 shares
- 1,150 Post Clicks
- 639 link clicks
Last year we reached more people with our Facebook post, but this year we received more link clicks and engagements which are more meaningful stats.
- 6,030 reach
- 190 likes
- 3 comments
- 20 sends
- 6 saves
- 198 profile visits (most likely to go click on the link in our bio)
Last year on our Instagram posts (we did 3), each post received less reach/engagements than this year’s post. (Which is why we consolidated our announcement post to a single post this year, clearly that was the right choice)
- 2020: 2,372 people saw our first IG story + 1,057 on our last IG story.
- 2019: 2,185 on the first story + 995 on our last.
Wells Ellenberg got the most swipe ups on his individual story, but the opening slide still got the most swipe ups. 33 on the opening slide vs. 28 on Wells’s slide.
The numbers for our story are very similar from last year to this year, but we received more link clicks this year which is the most important stat.
More web statistics can be found on the datasheet created by Buck Sharp for additional information related to the web traffic.
A press release was also published on UGA Today (and picked up by various publications) and featured on uga.edu.
Congratulations again to the teams who worked on this announcement! Great collaboraiton and teamwork!